Delulu
1st place at Hack MTY 2024, Gen AI challenge. We pointed cameras at the sponsor booths of a 1,500-person hackathon and turned the footage into heatmaps of where people gathered and how long they stayed, plus the sentiment of a recruiter call.
- Year
- 2024
- Stack
- Python, YOLOv8, OpenVINO, Whisper, LangChain, ChromaDB, FastAPI, Streamlit, MongoDB
The problem
Replacing a lost customer costs much more than keeping one, but businesses with physical locations know very little about what happens on their floor. A car dealership or a phone store has security cameras, yet nobody can tell where people gather, where they wait too long, or which conversations leave them happy. The footage is recorded and never used.
Delulu turns that footage into answers. We built it in one weekend at Hack MTY 2024 and won 1st place in the Gen AI challenge. I had the amazing opportunity of collaborating with three awesome engineers, Diego Rossi, Jocelyn Velarde, and Diego Leyva, on this hackathon to build one of the most amazing projects I've had the opportunity to participate in. The code is on GitHub.
The pilot: the hackathon itself
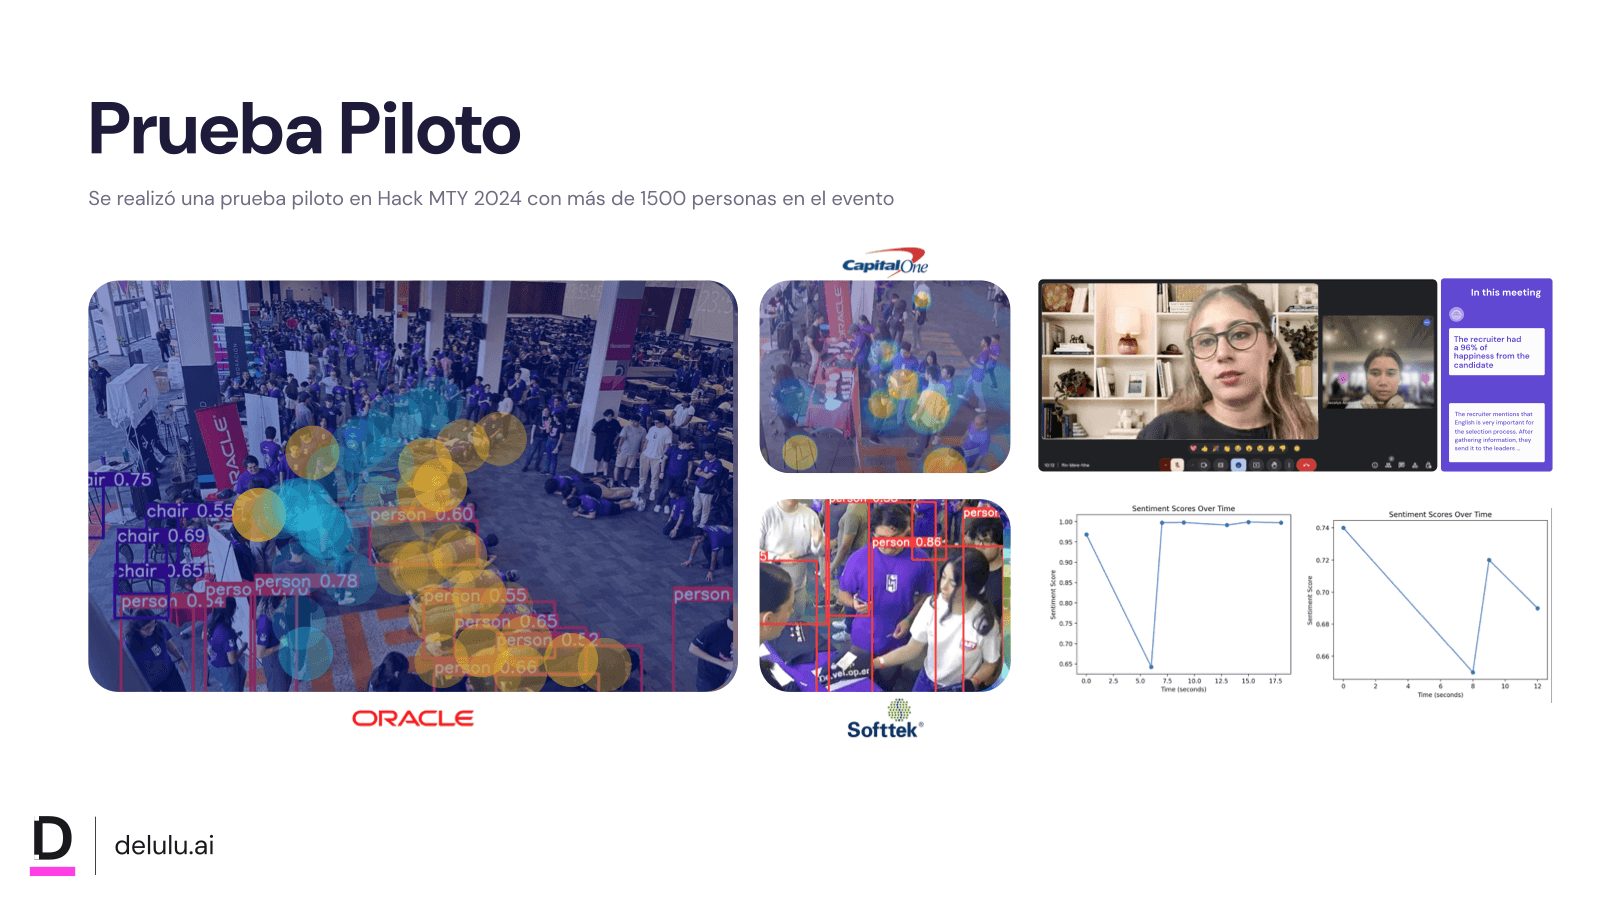
We didn't have a store to test in, but we had something close: a hackathon floor with more than 1,500 people, and sponsor booths that wanted the attention of every one of them. A booth works like a small store. People walk by, some stop, some line up, and a few talk to a recruiter. So we treated the sponsors as our first customers and pointed cameras at the Oracle, Capital One, and Softtek booths during the event.
This is what happened to the footage:
- Upload. Each recording went from the Streamlit dashboard to our FastAPI server.
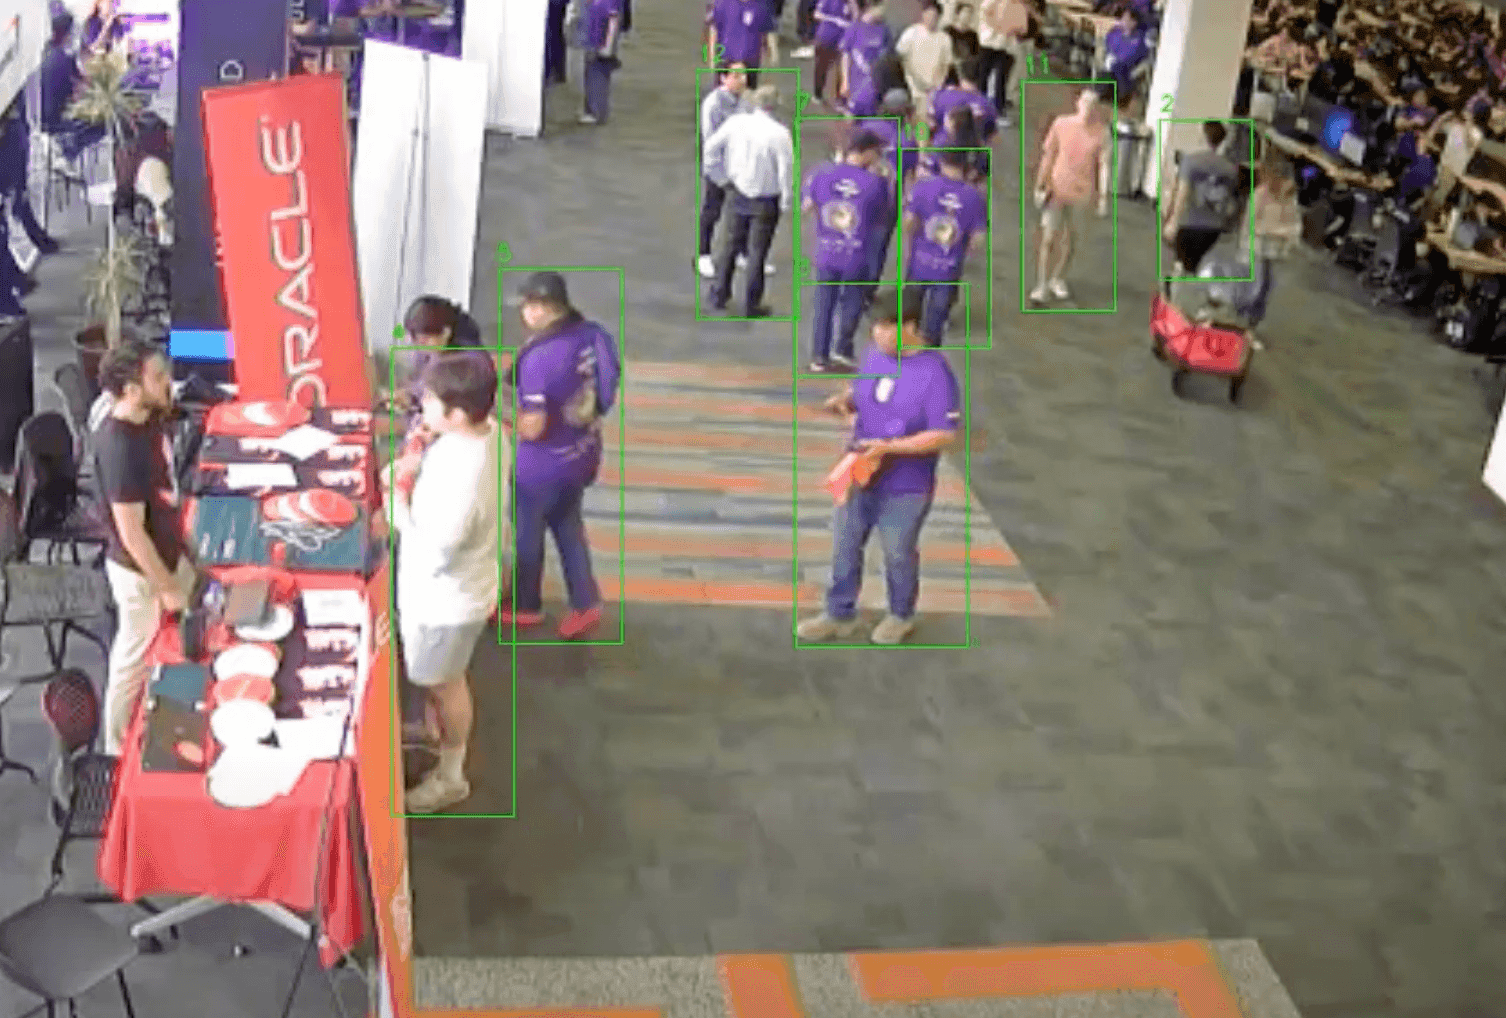
- Detect and track. YOLOv8 found every person in each frame and gave them an ID that follows them from frame to frame, so the same visitor counts once and not 30 times a second. A second model found faces. Both were exported to OpenVINO, so they ran on a regular Intel CPU without a GPU.
- Measure the stay. For each ID, the tracker logged when it entered the frame and how long it stayed, the closest thing a booth has to "time in store".
- Build the heatmap. The positions of every tracked person accumulate over the whole video. A spot where one person walked by stays cool, and a spot where people stood for minutes turns hot.
- Back to the dashboard. The tagged video and the heatmap video came back to the dashboard to watch and download.
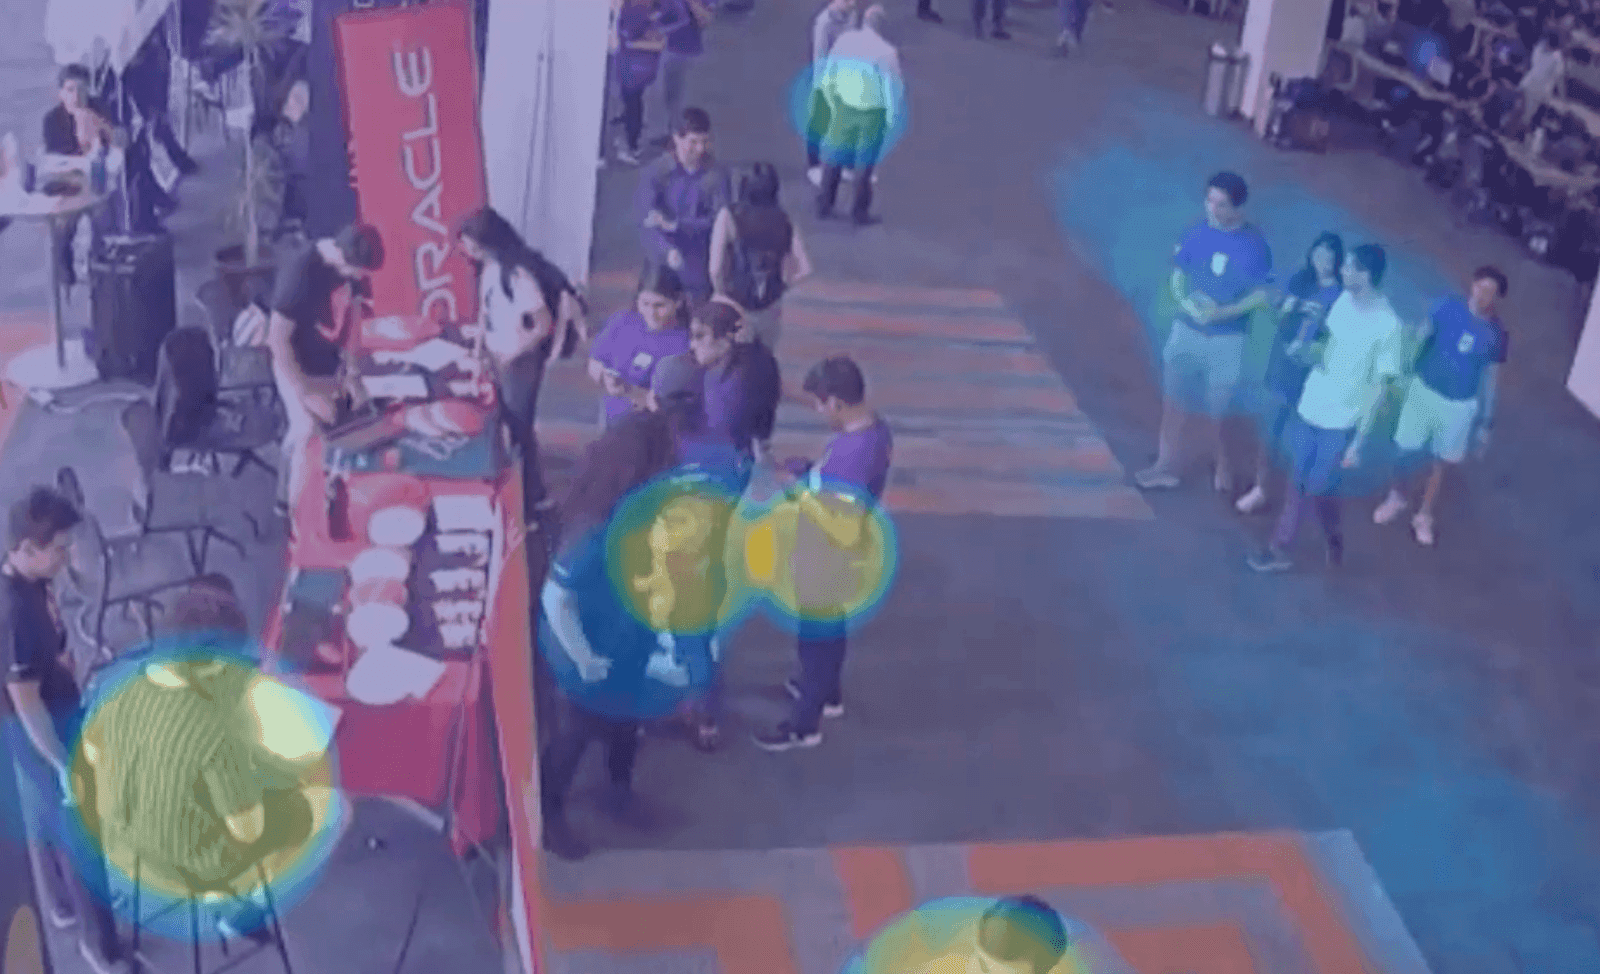
The result reads like a map of the floor. In the heatmap at the top, the hot spots sit at the booth's table, where visitors stopped to talk, while the open aisle stays cool. For a sponsor, that answers the same questions a store manager asks: where did people gather, how long did they stay, and where did the line form.
Listening to the conversations
Traffic tells you who stopped, but not how the conversation went. Sponsors come to a hackathon to recruit, so we also ran a recorded recruiter call through a second pipeline:
- Transcript. Whisper turned the recording into a transcript with timestamps.
- Sentiment over time. Each sentence went through a Spanish sentiment model (BETO), so the dashboard plotted how the mood changed during the call, not just one score at the end. Those are the two charts in the pilot slide.
- Questions about the conversation. The transcript was split, embedded, and stored in ChromaDB, and a language model answered questions about it with LangChain. Every analysis started with a summary, and the recruiter could ask things like "what does the candidate care about?"
The product
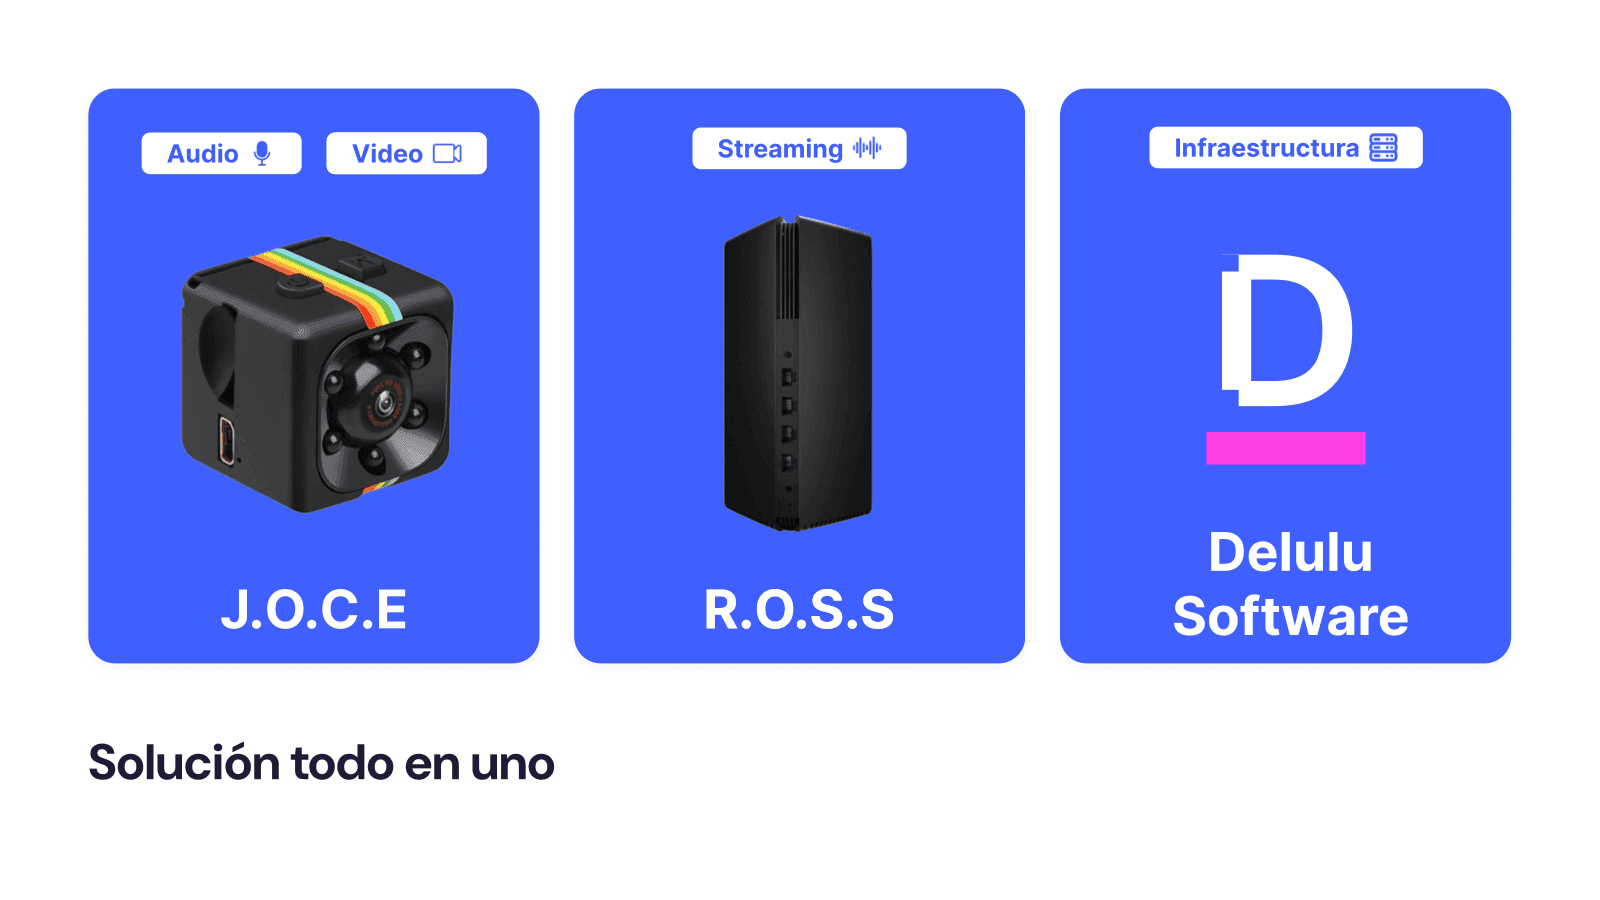
For a real business, it's three parts sold as one: a small camera with a microphone for each service point, an edge box that processes the video on site, and the software with the dashboard.