
Astral Tickets
A ticketing and entertainment platform for Astral Tickets: a public site for finding events and picking seats, and an internal dashboard for managing events, seat maps, sales, and printed tickets.
- Studio
- M.L Cats Consultancy
- Year
- 2025
- Stack
- Next.js, TypeScript, Tailwind CSS, shadcn/ui, Recharts
The goal
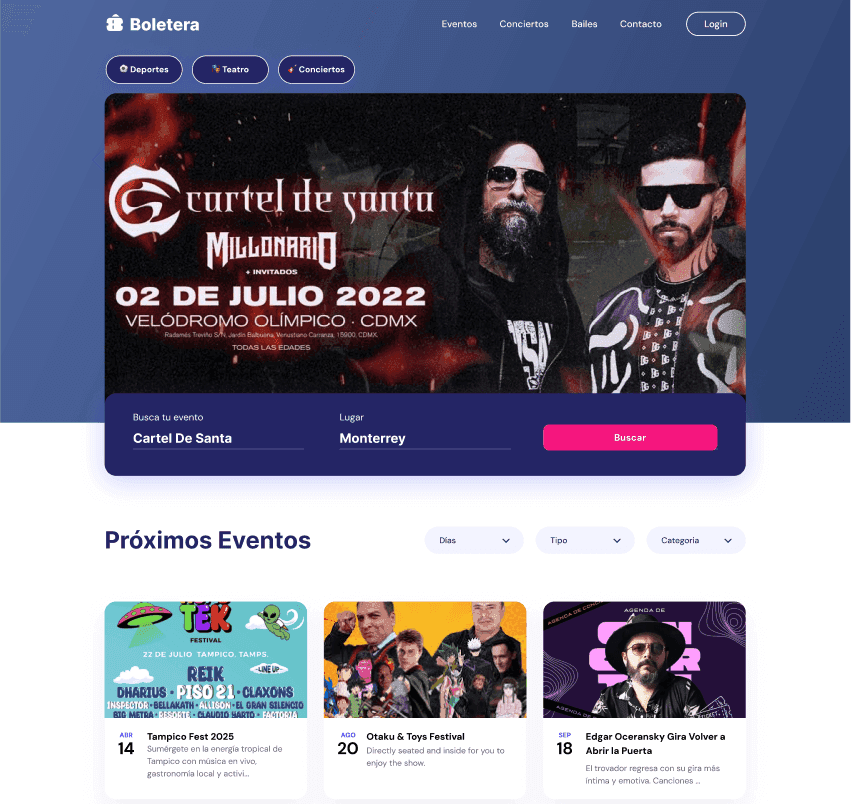
Astral Tickets is a ticketing platform for live events in Mexico, from concerts and shows to palenques. The project, which started under the working name Boletera, covered both sides of selling a ticket: the site where fans find an event and choose their seats, and the tools the team uses to set up events and run the box office.
Buying a ticket
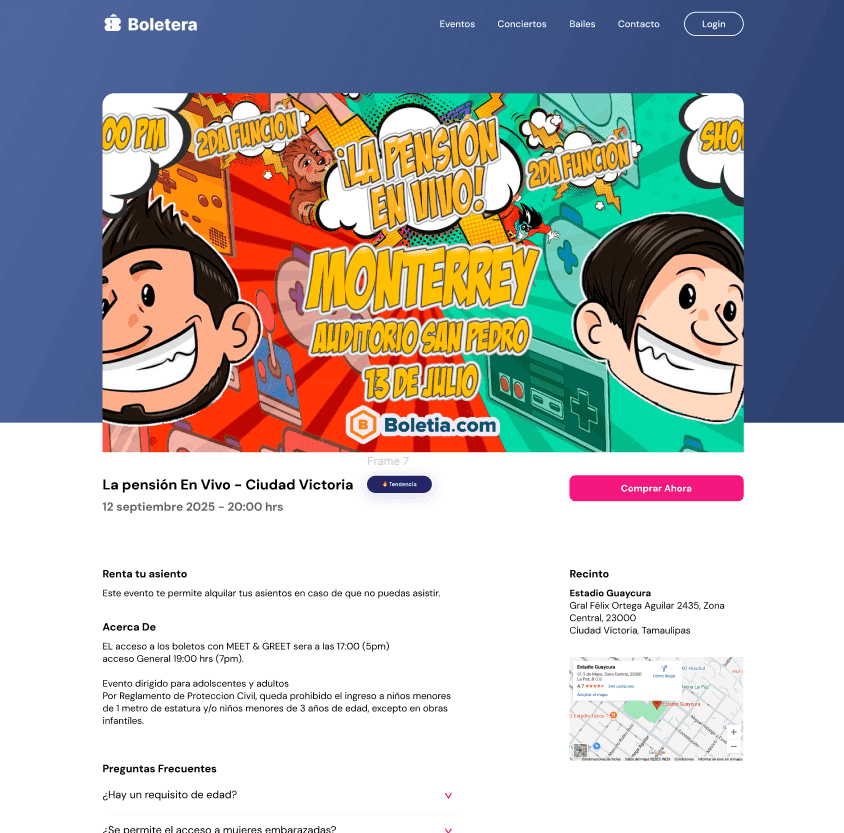
Fans can browse by category or search by event and city. Each event page has the date, the venue with a map, the event details, and an FAQ.
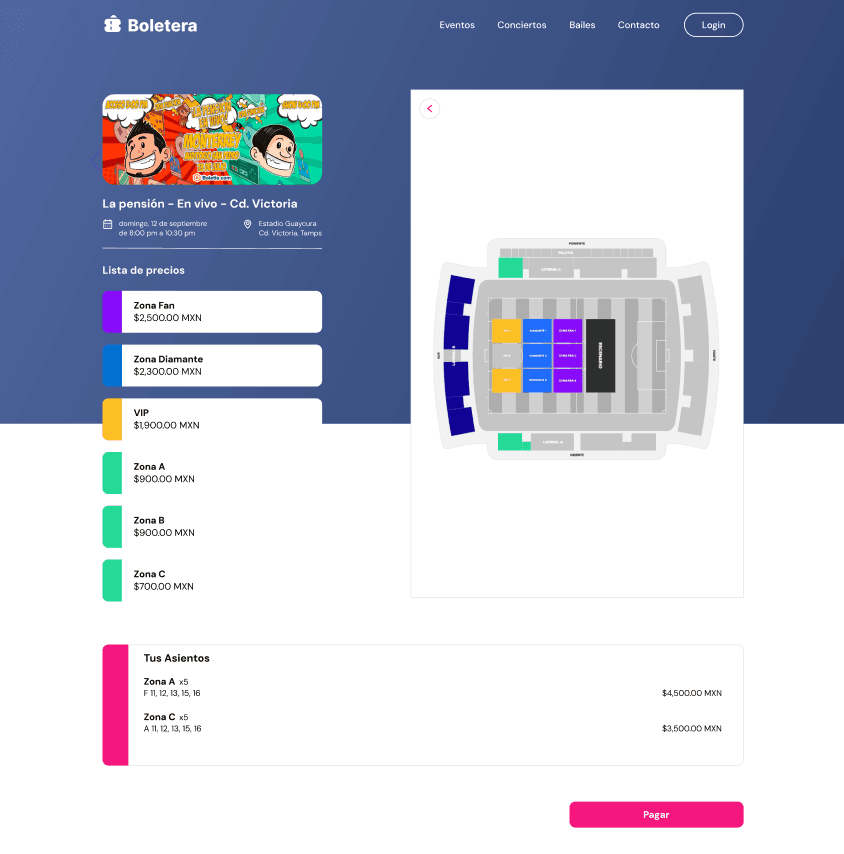
From there, fans pick their seats on the venue's map, with every zone and its price listed next to it, and see a running summary of their seats before paying.
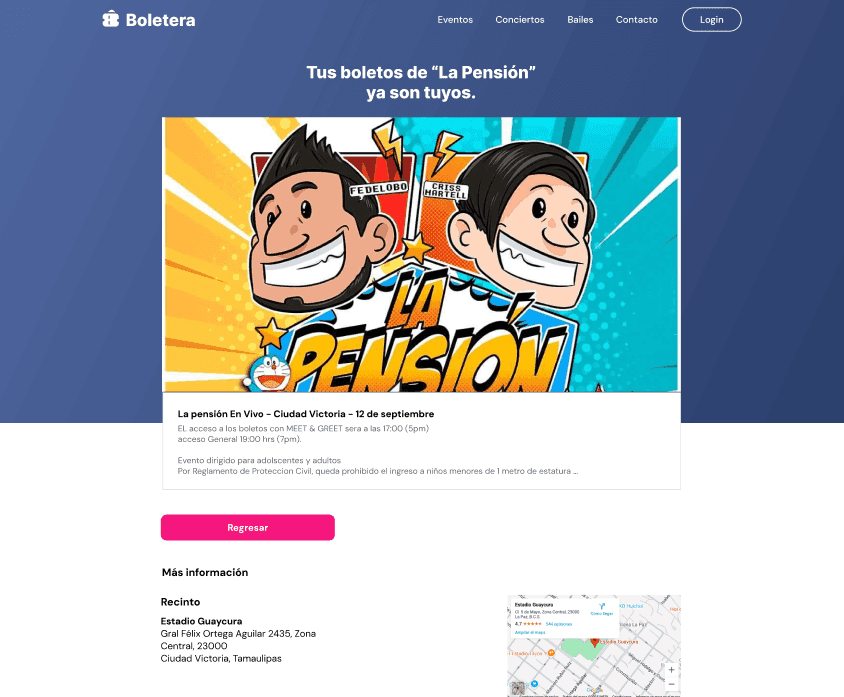
After checkout, the confirmation page shows the event again with the venue details, so everything a fan needs is in one place.
The dashboard
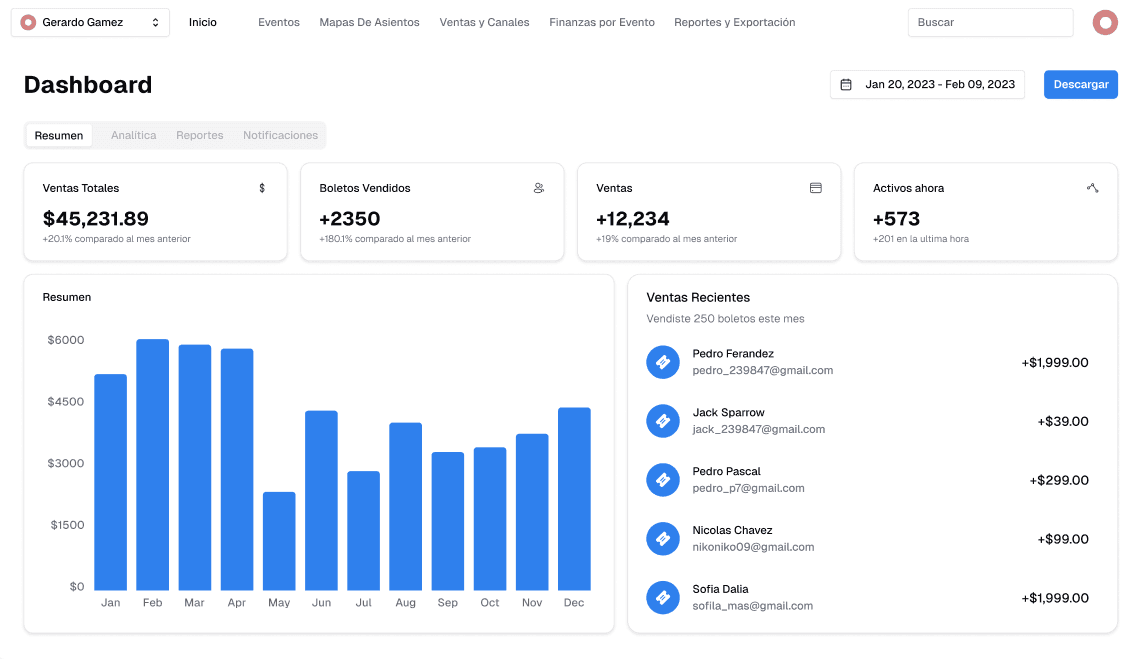
Behind the site, I built an internal dashboard in Next.js for the team. It has an overview of sales, tickets sold, and recent purchases, plus sections for events, seat maps, sales channels, per-event finances, and reports.
Seat maps generated from data
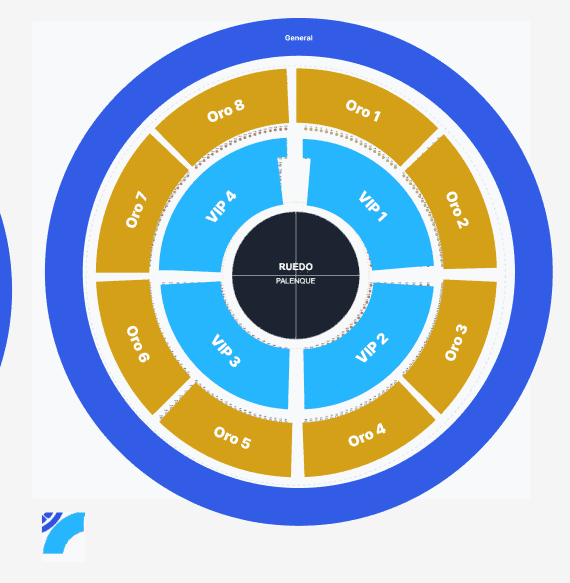
Palenques are round arenas with rings of seating around a central ring. Instead of drawing each venue by hand, the seat map is generated from a JSON description of the venue: each zone lists its angle, number of sections, rows, and price. The map lays out every row as an arc around the center, converting polar coordinates into seat positions, so a 2,400-seat venue becomes a clickable map where staff can select seats and see their zone and price.
Printed tickets
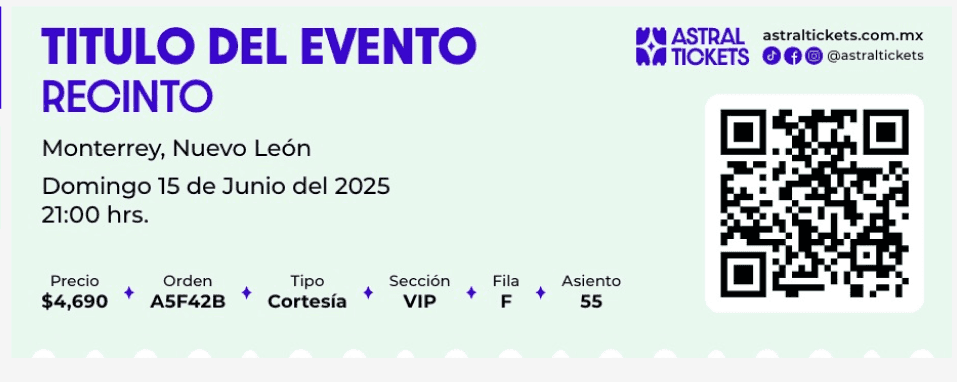
The box office also sells tickets in person, so the dashboard can print them. Staff fill in the section, row, seat, price, order number, and ticket type, and the dashboard sends it to a print service that produces the physical ticket with its QR code.
Working with the client
We worked through the full flow with the client, from the public site to the box office, before building the dashboard. The site's screens were designed first, covering search, the event page, seat selection, checkout, and confirmation, and I built the dashboard in Next.js. The screenshots here use sample data, since the client's sales and customer data is private.